Travel Tips
Lorem ipsum dolor sit amet, consectetur adipiscing elit.
面积图、填图、饼图
plt.plot.area()
plt.fill(), plt.fill_between()
plt.pie()
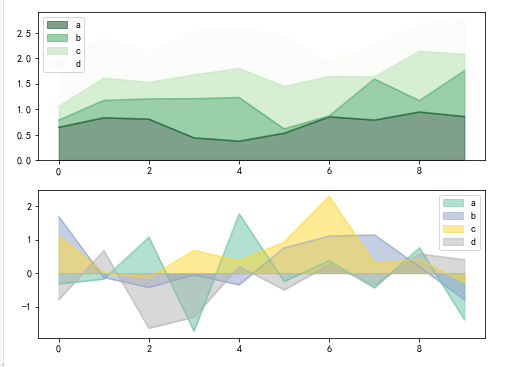
fig,axes = plt.subplots(2,1,figsize = (8,6))
df1 = pd.DataFrame(np.random.rand(10, 4), columns=['a', 'b', 'c', 'd'])
df2 = pd.DataFrame(np.random.randn(10, 4), columns=['a', 'b', 'c', 'd'])
df1.plot.area(colormap = 'Greens_r',alpha = 0.5,ax = axes[0])
df2.plot.area(stacked=False,colormap = 'Set2',alpha = 0.5,ax = axes[1])
# 使用Series.plot.area()和DataFrame.plot.area()创建面积图
# stacked:是否堆叠,默认情况下,区域图被堆叠
# 为了产生堆积面积图,每列必须是正值或全部负值!
# 当数据有NaN时候,自动填充0,所以图标签需要清洗掉缺失值
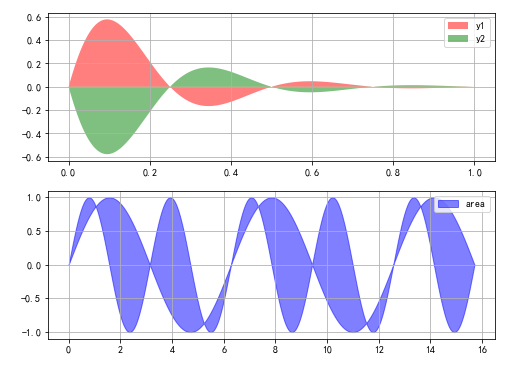
fig,axes = plt.subplots(2,1,figsize = (8,6))
x = np.linspace(0, 1, 500)
y1 = np.sin(4 * np.pi * x) * np.exp(-5 * x)
y2 = -np.sin(4 * np.pi * x) * np.exp(-5 * x)
axes[0].fill(x, y1, 'r',alpha=0.5,label='y1')
axes[0].fill(x, y2, 'g',alpha=0.5,label='y2')
# 对函数与坐标轴之间的区域进行填充,使用fill函数
# 也可写成:plt.fill(x, y1, 'r',x, y2, 'g',alpha=0.5)
x = np.linspace(0, 5 * np.pi, 1000)
y1 = np.sin(x)
y2 = np.sin(2 * x)
# y2 = 0.5
axes[1].fill_between(x, y1, y2, color ='b',alpha=0.5,label='area')
# 填充两个函数之间的区域,使用fill_between函数
for i in range(2):
    axes[i].legend()
    axes[i].grid()
# 添加图例、格网
# plt.pie(x, explode=None, labels=None, colors=None, autopct=None, pctdistance=0.6, shadow=False, labeldistance=1.1, startangle=None,
# radius=None, counterclock=True, wedgeprops=None, textprops=None, center=(0, 0), frame=False, hold=None, data=None)
s = pd.Series(3 * np.random.rand(4), index=['a', 'b', 'c', 'd'], name='series')
plt.axis('equal')  # 保证长宽相等
plt.pie(s,
       explode = [0.1,0,0,0],
       labels = s.index,
       colors=['r', 'g', 'b', 'c'],
       autopct='%.2f%%',
       pctdistance=0.6,
       labeldistance = 1.2,
       shadow = True,
       startangle=0,
       radius=1.5,
       frame=False)
print(s)
# 第一个参数:数据
# explode:指定每部分的偏移量
# labels:标签
# colors:颜色
# autopct:饼图上的数据标签显示方式
# pctdistance:每个饼切片的中心和通过autopct生成的文本开始之间的比例
# labeldistance:被画饼标记的直径,默认值:1.1
# shadow:阴影
# startangle:开始角度
# radius:半径
# frame:图框
# counterclock:指定指针方向,顺时针或者逆时针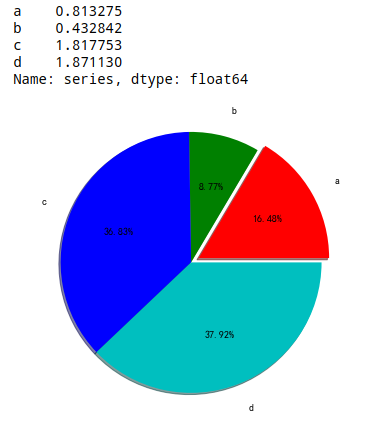
plt.hist(x, bins=10, range=None, normed=False, weights=None, cumulative=False, bottom=None,
histtype='bar', align='mid', orientation='vertical',rwidth=None, log=False, color=None, label=None,
stacked=False, hold=None, data=None, **kwargs)
# 直方图与柱状图完全不一样,
# 柱状图直接根据数据得到一个数据结果
# 直方图是根据源数据获得一个概率分布
s = pd.Series(np.random.randn(1000))
s.hist(bins = 20,
       histtype = 'bar',
       align = 'mid',
       orientation = 'vertical',
       alpha=0.5,
       density =True)
# The 'normed' kwarg was deprecated in Matplotlib 2.1 and will be removed in 3.1. Use 'density' instead.
#  alternative="'density'", removal="3.1")
# bin:箱子的宽度
# density 标准化,
# histtype 风格,bar,barstacked,step,stepfilled
# orientation 水平还是垂直{‘horizontal’, ‘vertical’}
# align : {‘left’, ‘mid’, ‘right’}, optional(对齐方式)
s.plot(kind='kde',style='k--',grid=True)
# 密度图
plt.figure(num=1)
df = pd.DataFrame({'a': np.random.randn(1000) + 1, 'b': np.random.randn(1000),
                    'c': np.random.randn(1000) - 1, 'd': np.random.randn(1000)-2},
                   columns=['a', 'b', 'c','d'])
df.plot.hist(stacked=True,
             bins=20,
             colormap='Greens_r',
             alpha=0.5,
             grid=True)
# 使用DataFrame.plot.hist()和Series.plot.hist()方法绘制
# stacked:是否堆叠
df.hist(bins=50)
# 生成多个直方图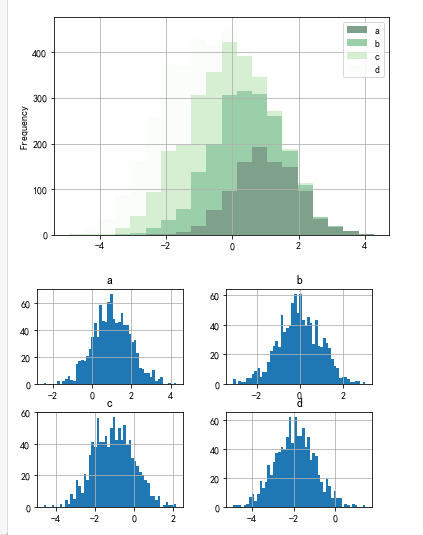
plt.scatter(), pd.scatter_matrix()
# plt.scatter()散点图
# plt.scatter(x, y, s=20, c=None, marker='o', cmap=None, norm=None, vmin=None, vmax=None,
# alpha=None, linewidths=None, verts=None, edgecolors=None, hold=None, data=None, **kwargs)
import numpy as np
np.seterr(divide='ignore', invalid='ignore')
# RuntimeWarning: invalid value encountered in sqrt
#  scale = np.sqrt(self._sizes) * dpi / 72.0 * self._factor
plt.figure(figsize=(8,6))
x = np.random.randn(1000)
y = np.random.randn(1000)
plt.scatter(x,y,marker='.',
            s = 10, # 大小可以表示第三维度
#            s = np.random.randn(1000)*100,
           cmap = 'Reds',
           c = y,# 可以表示第四个维度
           alpha = 0.8,
           )
plt.grid()
# s:散点的大小
# c:散点的颜色
# vmin,vmax:亮度设置,标量
# cmap:colormap

# pd.scatter_matrix(frame, alpha=0.5, figsize=None, ax=None,
# grid=False, diagonal='hist', marker='.', density_kwds=None, hist_kwds=None, range_padding=0.05, **kwds)
df = pd.DataFrame(np.random.randn(100,4),columns = ['a','b','c','d'])
# AttributeError: module 'pandas' has no attribute 'scatter_matrix'
pd.plotting.scatter_matrix(df,figsize=(10,6),
                 marker = 'o',
                 diagonal='hist',
                 alpha = 0.5,
                 range_padding=0.1)
# diagonal:({‘hist’, ‘kde’}),必须且只能在{‘hist’, ‘kde’}中选择1个 → 每个指标的频率图
# range_padding:(float, 可选),图像在x轴、y轴原点附近的留白(padding),该值越大,留白距离越大,图像远离坐标原点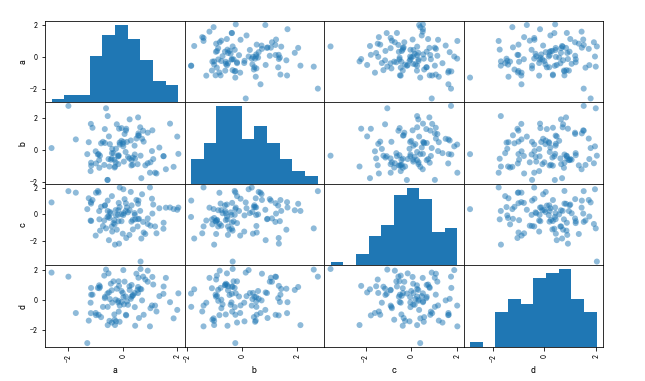

Sed ac lorem felis. Ut in odio lorem. Quisque magna dui, maximus ut commodo sed, vestibulum ac nibh. Aenean a tortor in sem tempus auctor
December 4, 2020 at 3:12 pm

Sed ac lorem felis. Ut in odio lorem. Quisque magna dui, maximus ut commodo sed, vestibulum ac nibh. Aenean a tortor in sem tempus auctor
December 4, 2020 at 3:12 pm

Donec in ullamcorper quam. Aenean vel nibh eu magna gravida fermentum. Praesent eget nisi pulvinar, sollicitudin eros vitae, tristique odio.
December 4, 2020 at 3:12 pm
我是 s enim interduante quis metus. Duis porta ornare nulla ut bibendum
Rosie
6 minutes ago